The Discipline Consequence Proportionality Report is designed to enable district staff to examine student sub-groups with user-selected consequences, such as Expulsions or Out of School Suspensions, compared to their representation in the overall student population and the number of discipline incidents resulting in Expulsions or Out of School Suspensions.
Administrators can create a Discipline Consequence Proportionality Report for one or more subgroups, including gender, federal race code, and programs, and can download the detailed data for validation.
ACCESSING REPORTS
Reports may be accessed by navigating to the Reports App within the Data Extracts Bundle, clicking Launch App, and then clicking Create New Report from the left navigation menu.
Next, browse to the District Reports Folder and click Browse Category.
Locate the Discipline Consequence Proportionality Report and click Build Report.
Select optional Student Groups, School Year, School(s), Grades, Genders, Federal Race Codes, and Programs. Next, select the required Discipline Consequences and Title the Report. When done, click Save and Generate. In addition, you may select Generate Report (PDF Download), Save Configuration (save and name to My Reports), or download the Validation Workbook (to view the data used to generate the report) from the drop-down menu.
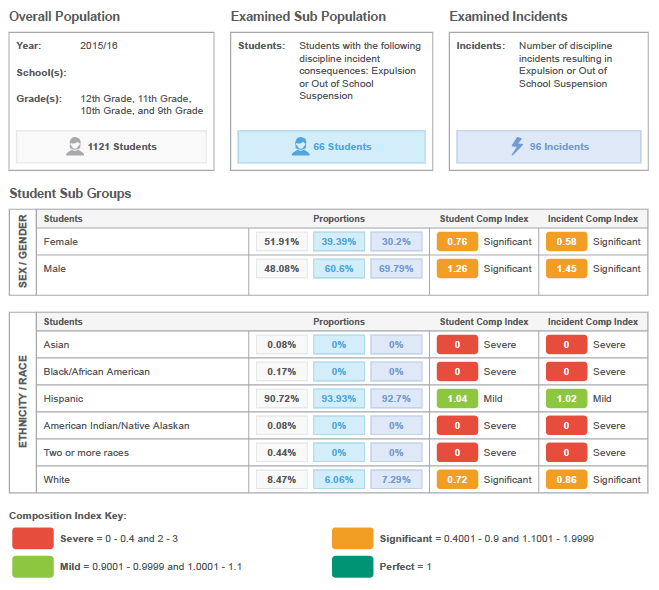
The report lets the user determine an overall student population by filtering by district, school(s), and/or grade level(s).

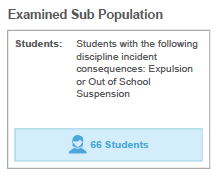
We then determine the number of students (from that group) who have a discipline incident resulting in the consequences of Expulsion and/or Out-of-School Suspension.
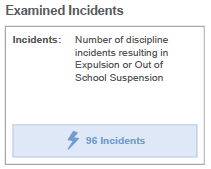
Next, for the given population, we determine the number of incidents that resulted in expulsion or suspension.
Of that base population, we determine three things:
- What percentage of the overall population is from the subgroup
- What percentage of the suspended /expelled students are in the subgroup
- What percentage of the suspension is attributed to the subgroup
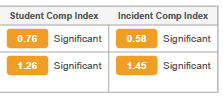
We use these numbers to produce the composition indexes.
For example:
Female Students compose 52.42% of the overall population, but only 39.68% of the examined subpopulation. Therefore, they are significantly under-represented, with a composition index of (39.68% / 52.42%) 0.76
Female Students compose 52.42% of the overall population, but only 31.11% of the examined incidents. Therefore, they are significantly under-represented, with a composition index of (31.11% / 52.42%) 0.59
Note: The composition index ranges can be modified, as well as the colors displayed, and the labels (Perfect, Mild, Significant, Severe)—contact support@schooldata.net.
(updated 2/9/2023)
Comments
0 comments
Article is closed for comments.