Charts enable you to share your data visually, clearly, and concisely. Charts may be used in Homeroom Dashboards to display in a container, as a browser bookmark, a link in Logins and Link, or as email distributions. For example, you can use these charts to show student growth evidence for TPEP, display assessment results for your school improvement plan, or compare the performance of schools for your Board Meetings.
ACCESSING CHARTS
Charts may be accessed by navigating to the Charts Application within the Data Extracts Bundle, clicking Launch Application, and then clicking Create New Chart from the left navigation menu.
Next, browse to find a chart of your choice and click Browse Category.
BREADCRUMBS
As you browse the categories, notice that the breadcrumbs at the top of the page clearly indicate where you are and how you got there. Those breadcrumbs also allow you to return to any category by clicking them.
Charts may be viewed in various ways. Select the Actions Gear in the far right corner to display as a Grid, Columns/Masonry, or List. Here you may also search for a table by using keywords.
Each data table includes the following actions:
|
Click to reveal a further description of the Chart. |
|
|
Chart details and configurations. |
|
|
Learn More - A realistic example, a descriptive title, and an informative description if available. |
|
|
FAVORITES - Mark the chart to retrieve easily at a later time. |
BUILD A CHART
Once you've identified a chart that meets your needs, the next step is to configure it by clicking Build Chart.
Make selections, then click Render Chart.
When completed, click the Action Gear to the right to view options.
Save & Name - Save your parameters for later. (Label, Description (optional), and Analysis (optional)). Saved charts may then be located in My Charts for later access.
View Configuration Settings - This allows the user to see the inputs selected on the configuration screen.
Download Options:
- JPEG: image format
- PDF Portrait: PDF with the chart printed vertically on the page
- PDF Landscape: PDF with the chart printed horizontally on the page
- PNG: image file; it gives the most image detail of the image formats, but it also results in large file sizes compared to the JPEG format
- Validation Workbook creates an XLSLX spreadsheet
HIDE AND SHOW DATA ON A CHART
To better isolate specific data, the Chart Manager application can hide and show chart data. For instance, if the chart rendered includes data on all services, but the user is only interested in the Free and Reduced lunch service at this time, all other services can be hidden. Or maybe the chart just has too much data to be read accurately; hiding some data will allow the user to see some data points better.
After rendering a chart, click the specific piece to hide in the chart's legend.
Removing all the performance levels (because the goal doesn't have to be tied to a performance level) makes the goal stand out.
FAVORITES
When you find a chart that meets your needs, it's often helpful to mark it as a "Favorite," which is done by clicking the "heart" icon. This way, you can find it again easily by navigating to the My Favorite Charts Folder under My Charts.
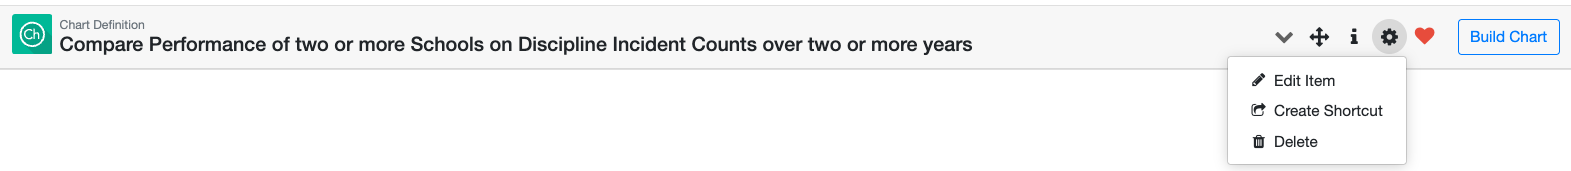
To edit, create shortcuts, or delete favorites, simply locate the chart and click on the Action Gear.
 MY CHARTS
When you save or favorite a chart, it becomes available on the My Charts page. Here we see a list of every chart rendered and saved. When we select a saved chart, we can see each version of the chart we have configured and rendered. You can save an up-to-date version at any time or change the configuration options to create multiple charts used for comparisons.
DISTRICT FAVORITES
Navigate to Manage District Favorites under District Favorites in the left navigation pane.
Select Add Record in the top right corner.
Click Select, choose your charts by clicking the checkmark in the new window, and click Add Charts.
Click Add once more.
District favorites will now appear under View District Favorites in the left navigation pane.
CHARTS AS LOGINS/LINKS
Popular data tables may be added to Logins and Links in Homeroom Dashboards by yourself or your district. For a district-wide link, contact support@school data.net, or for further instructions, check out the Homeroom Dashboards - Logins & Links.
From the Chart application, copy the unique URL for the Chart. If a Chart, the unique URL from the My Favorite Chart category can be added instead or in addition.
In Homeroom Dashboards, click My Creations from the left-hand navigation menu, then click My Logins/Links.
Click the Action Gear in the upper right-hand corner and select Create New Login/Link.
From the pop-up window, click Link, then paste in the unique URL for the Data Table, type in the label, and Save.
Comments
0 comments
Please sign in to leave a comment.